
Elisha Prophesies the End of Samaria’s Siege by Nicolas Fontaine, 1625-1709.
In our last installment, we discussed opportunity cost using the example of the four lepers at the gate of Samaria (2 Kings 7:3-5).
The prospects facing of these gentlemen were all seemingly poor. They could remain where they were and die, they could enter the city of Samaria and die, or they could defect to the Syrians and maybe die or maybe live. Choosing any one of the three options meant forgoing the other two opportunities.
Quite rationally, the lepers elected to forgo the opportunity of dying in Samaria, either outside its gates or within the city itself, for the outside chance that they might survive among the Syrians. The two options of dying in Samaria, we concluded, represented the opportunity cost to the lepers of their decision to go over to the Syrians.
The Samaritan Consumer Price Index
At the same time the lepers were reasoning among themselves about their opportunity cost, inside the city walls of Samaria another discussion was taking place.
By this point, King Jehoram of Israel had had quite enough of the whole siege business and was ready to take it out on someone. The most obvious scapegoat in his mind was the prophet Elisha. Such was the king’s anger with Elisha that he had dispatched one of his high ranking officers to take off the prophet’s head.
This came as no surprise to the prophet, who, apparently forewarned by God that a plot had been hatched against him, told those with whom he was sitting, “Do you see this son of a murderer has sent someone to take away my head? Look, when the messenger comes, shut the door, and hold him fast at the door. Is not the sound of his master’s feet behind him?” (2 Kings 6:32).
When the king’s messenger arrived, Elisha had a message for him. Said Elisha, “Hear the word of the LORD. Thus says the LORD: ‘Tomorrow about this time a seah of fine flour shall be sold for a shekel, and two seahs of barley for a shekel, at the gate of Samaria’ ” (7:1).
Incredulous, the officer responded, “Look, if the LORD would make windows in heaven, could this thing be?” To which Elisha answered, “In fact, you shall see it with your eyes, but you shall not eat of it” (7:2).
What Elisha described to the officer was a dramatic drop in what today we would call the Consumer Price Index (CPI). You may recall from our discussion in Part 1 that some of the worst food imaginable was going for extraordinarily high prices. A donkey’s head was selling for eighty shekels of silver and a pint of bird dung for five shekels.
But here’s Elisha saying that the very next day, not only would highly desirable flour and barley be available for purchase, but that they would be far cheaper than the awful fare the Samaritans had been eating up to that point. This was just too much to be believed.
On one hand, the officer’s rejection of Elisha’s prophecy was clearly sinful, for he disbelieved the word of God. On the other hand, his disbelief, if not praiseworthy, is at least understandable.
Stop for a moment and consider your own experience with prices. Over time, do prices tend to go up or go down? Most of us would say prices tend to go up. I recall as a kid in late 70’s when gas broke $1.00/gallon. People were horrified. Late last year, gas in my area got down to about $1.50 a gallon and most people considered it dirt cheap. This was because the CPI during the intervening years had crept steadily upward, so that $1.50/gallon now seemed like a pretty good deal.
To give you a sense of how much the US CPI has risen over time, consider the following chart put out by the Federal Reserve Bank of St. Louis.
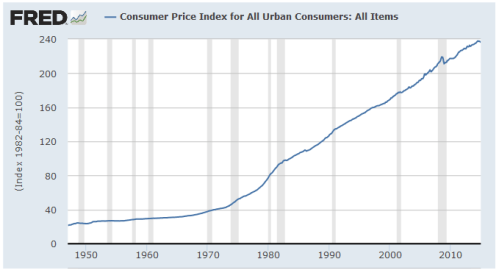
The CPI measures the average price for a defined basket of good. As you can see, the data series for this CPI chart begins prior to 1950 and runs up to the current day. Notice how the curve trends slightly upward until shortly after 1970, when it begins to rise much more rapidly, continuing on about the same upward trend until the present. There’s a reason for this, which we’ll come back to in a moment.
But for now, ask yourself what you would say if someone were to tell you that tomorrow about this time a gallon of gas would sell for $0.18/gallon (1950 price). I know I ‘d be a bit skeptical. But that’s not unlike what Elisha told the officer.
In fact, the price drop prophesied by Elisha was far more dramatic than my example of the price of gasoline. Whereas in my example, I compared the price of the same item (gasoline) over time, Elisha asserted that the price of highly desirable wheat would fall below the current price of bird droppings.
If we had a Federal Reserve Chart of the Samaritan CPI it would be the reverse of the one above. Instead of an upward sloping curve indicating rising prices over time, we would have a much sharper downward sloping curve showing a dramatic, sudden drop in prices.
Inflation, Deflation and CPI
In our everyday language, we tend to identify rising prices with inflation, and rare cases of falling prices we call deflation. But inflation is not the same thing as rising prices. Inflation and deflation describe respectively the increase and decrease in the supply of money and credit within an economy, rising and falling prices, on the other hand, are the effects of these changes.
Here’s what economist and investment manager Peter Schiff has to say about the relationship between changes in the money supply and prices,
Inflation means expansion, in the same sense that a balloon expands when you blow air into it. In economics, inflation refers to expansion of the amount of dollars in circulation, called the money supply. When new money or credit is added to an economy, thus diluting the existing supply, the general level of prices (aggregate prices) will rise, assuming the amount of goods and services within the system stays the same. But understand the distinction: The money supply expands and contracts. Prices go up and down. Inflation and price increases are not the same thing. One is cause. The other is effect (Crash Proof, 69).
Or as economist Milton Friedman succinctly put it, “Inflation is always and everywhere a monetary phenomenon.”
Now let’s go back and consider the CPI chart above. As we noted, the graph indicates prices began to increase faster beginning shortly after 1970. Why is this? Given what we know about the relationship between inflation and prices – inflation (growth in the supply of money) tends to push up prices – we have good reason to suspect that the supply of money and credit began to grow faster than the overall amount of goods and services available in the economy. And that’s exactly what happened.
Below is another chart from the Federal Reserve Bank of St. Louis showing the adjusted monetary base for the period 1/1/1918 through 5/1/2016.
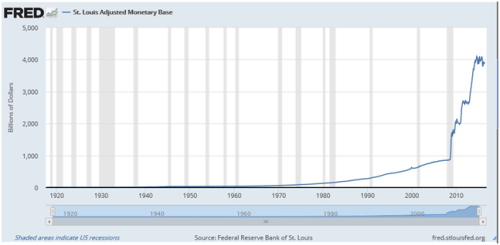
Note how the monetary base remains relatively flat through about 1970 and then begins its upward trend, continuing to expand at a slowly increasing rate until around 2009.
What’s so special about the early 70’s that would cause the monetary base to begin to expand?
Final Death of the Gold Standard
From the end of WWII until August 15, 1971, the world monetary system was governed by the Bretton Woods agreement. Bretton Woods featured the US dollar as the world’s reserve currency, the value of which was tied to gold at the rate of $35 per ounce. All other currencies were priced relative to the US dollar.
During the 1960s spending by the US federal government began to rapidly increase due to a combination of the Vietnam War and president Johnson’s expansion of the welfare state known as the Great Society.
In order to pay the bills for these expensive programs, the US Treasury had to issue bonds, thus increasing the amount of credit in the system much faster than the economy itself was growing. When the money supply (amount of money and credit in an economy) is inflated faster than the economy itself grows, you get rising prices.
As long as the US dollar was anchored to gold, this made it difficult for the federal government to grow the money supply as fast as it wanted to pay its rising bills. On August 15, 1971, president Nixon permanently severed the link between the dollar and gold. No longer would the dollar be valued relative to gold.
As a result, the government was free to inflate the money supply at a much faster pace than it had previously. And this is exactly what it did. The rapidly expanding money supply we see in the second chart is what caused the rising CPI shown in the first chart.
Quantitative Easing
In the second chart above, you may have noticed the sharp upward spike in the money supply at the right hand side of the graph. This spike is the result of that most wonderful invention of modern central bankers known as Quantitative Easing (QE).
So just what is QE anyway? In short, it’s money printing on a massive scale by the Federal Reserve. It’s also the practice of other major central banks such as the Bank of Japan and the European Central Bank.
If you look closely at the chart you can see that the Federal Reserve’s QE program has functioned a bit like a multi-stage rocket. The first stage, now knows as QE 1, was done in response to the financial crisis of 2009-2009, which was brought on by too much debt in the financial system.
So, what did the US federal government and central bankers do in response to a crisis brought on by too much debt? Why, the only sensible option available to them. They created more debt! The treasury issued new bonds and the Federal Reserve (the Fed) created the money out of thin air to buy them up. The Fed also bought large quantities of Mortgage Backed Securities ( (MBS) from major commercial banks as well. This was a huge subsidy to the banks, as the Fed paid 100 cents on the dollar for these securities even though their market value was far less than that.
The amount of money created by the Fed as part of the QE 1 bailout of the financial system was over $1.4 trillion.
QE1 worked so well that the Fed decided it needed an encore, so it came back in late 2010 with QE 2, in which it created another $600 billion in credit to purchase more Treasury bonds.
Apparently believing that three’s a charm, the Fed came back with another dose of QE in 2012. QE 3, as it is known, was the biggest blast of money creation yet, coming in at an astonishing $1.7 trillion by the time the dust settled.
What’s the morality of QE? In short, God hates it. QE is simply an official version of counterfeiting. Or to use the language of Scripture, it’s the equivalent of using false weights and measures. The sort of thing that God calls an abomination, see Proverbs 20:10, 23. For just as dishonest merchants used false weights and measures to rip off their customers in the days of Elisha, so too do contemporary central bankers use QE to transfer wealth from middle class savers and the poor to their high powered client banks. And what’s even better for the-powers- that-be is that hardly anyone understands what they’re up to.
Wealth transfer by means of QE is responsible for much of the growing income inequality in Western nations as well as the growing social instability that has resulted from it. Had the West remained on the gold standard, even one as flawed as the Bretton Woods agreement, QE would have been an impossibility. This is the real reason why central bankers and the politicians who love them constantly deride gold and the gold standard, refusing to even consider it as a legitimate alternative to their current monetary madness.
With the world economy continuing its slide into recession, in my opinion another round of QE stimulus by the Fed is in the offing, one that likely will be bigger than any yet seen. But that’s grist for another post.
Conclusion
The sudden, miraculous drop in the Samaritan CPI prophesied by Elisha came to pass exactly as the prophet said. Lord willing, next week we will take a closer look at it.
But for now, the key takeaways from this installment are 1) inflation/deflation and rising/falling prices are not the same thing, 2) inflation describes the increase in the supply of money and credit in an economy; deflation is the decrease in the supply of money and credit, and 3) assuming the supply of goods and services in an economy remains the same, rising/falling average prices are the result of the inflation/deflation of the money supply.
To be continued…

[…] Source: Biblical Economics: The Siege of Samaria, Part 4 […]