
US Treasury yield curve as of close of business on 3/22/19. Note the highlighted areas on the chart showing the 1-month Treasury yield is higher than the 10-year Treasury yield. This abnormal situation is widely considered to be the most accurate predictor of a future recession. (Source, CNBC).
You may have heard that the US stock market got smacked around pretty hard today. The Dow was off 460.19 or 1.77%. The S&P and NASDAQ had it even worse, off 1.90% and 2.50% respectively.
But while the stock market plunge took center stage today, a major secondary story was the continuing inversion of the US Treasury yield curve. Typical was the headline on CNBC which read Bonds are flashing a huge recession signal – here’s what happened to stocks last time it happened.
The article goes on to quote equity strategist Jonathan Golub saying that a yield curve inversion has preceded each recession over the last 50 years. Golub is hardly alone in saying this. If you listen to knowledgeable investors, they consistently will tell you that a yield curve inversion is the most accurate predictor of an oncoming recession. But this raises the question, So just what is a yield curve inversion anyway?
To answer that question let’s start by defining what a yield curve is. According to this article on Fidelity.com, “A yield curve is a way to measure bond investors’ feelings about risk.” In the piece, there’s a picture showing a normal yield curve.
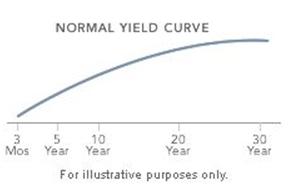
What this graph shows is that, under normal conditions, the interest rate on short term bonds is lower than the interest rate on long term bonds. The reasoning behind this is that the longer a lender commits funds to a borrower, the more risk he takes and the more reward he deserves for taking on this risk.
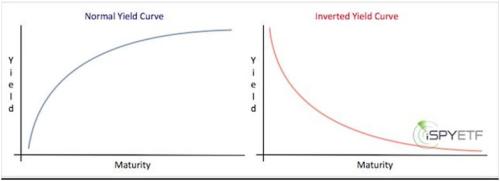
If a normal yield curve shows lower interest rates for short term bonds, and higher interest rates for long term bonds, an inverted yield curve is exactly the opposite. It’s when short term rates are higher than long term rates. See below for a side by side comparison between a normal and an inverted yield curve.
So now that we know what both a normal and an inverted yield curve is, and that an inverted yield curve is a remarkably accurate predictor of recession, let’s ask another question, Why is an inverted yield curve a harbinger of recession?
According to investment analyst Dave Kranzler, “The Treasury curve ‘flattens’ when the short end of the curve rises relative to the long end. The curve flattens when the market has decided that the Fed is wrong on its policy of raising the Fed Funds rates because the economy is slowing down. Large Treasury buyers pile into 10yr and 30yr Treasurys on the expectation that a deteriorating economy will force the Fed to reverse course and lower rates again.”
To unpack this a bit, it’s important to understand the relationship between bond prices and bond interest rates. One common way of speaking about bond prices and their relationship to interest rates is the “bond teeter totter.” For this, see the image below.

In short, the bond teeter totter says that as bond prices go down, bond yields go up. Conversely, as bond prices go up, bond yields go down.
What Dave Kranzler is saying is that when large bond investors think the Federal Reserve has raised Fed Funds rates too much (the Fed Funds rate is a short term interest rate) they aggressively buy long term US Treasurys. When large buyers aggressively buy long term Treasurys, they drive up the price of those Treasurys. As the bond teeter totter tells us, when the price of these long term bonds goes up, their yield (interest rate) goes down. In some cases, the yield of the long term bonds can go down far enough that it’s lower than the yield of short term Treasurys resulting in an inverted yield curve.
By piling into long term Treasurys, large bond investors are locking in what they consider to be a safe long term yield once, as they believe, the Fed is forced to lower the short term interest rate to combat a recession.
I realize all this is somewhat technical and may seem a little overwhelming to those who aren’t familiar with financial markets. But while it may seem like uncharted territory, it’s worth taking a few minutes to understand the concepts of bond yields and their relationship to bond prices. Understanding this allows us to understand why yield curves invert and why this is such a strong predictor of recession.
As the Lord’s people, I firmly believe that it’s imperative for Christians to get educated about financial matters. Not only for the our own well-being and that of our families, but also as a witness for Christ himself. When the next financial crisis comes, and come it will, perhaps sooner rather than later, what kind of a witness will we be if we’re just as panicked and lost as those who do not know the Lord?
The inverting yield curve should be a warning to us to put our financial affairs in order. In short, this means paying off debt, putting some money away in savings, perhaps getting more conservative with our stock investments, and maybe even buying some gold and silver.

A clear explanation and timely warning Steve. Thx.
You’re welcome, John.